A large storm cloud with a tornado in the distance at dusk.
Shows a tornado local storm report falling within the higher probability contours of a tornado PHI plume during a hurricane.

About PHI

Learn about PHI and the machine-learning algorithms that form the basis of it.

A single severe PHI plume for a single storm shows how, when paired with NWS warnings, the PHI plume can provide notice of severe weather ahead of the warning.

Live Data

View placefiles of PHI data in real time in Gibson-Ridge 2 Analyst (GR2).

Lightning bolts in the sky at night

NSSL's Vision

See how PHI fits into the mission of the National Severe Storms Laboratory (NSSL).

What is PHI?

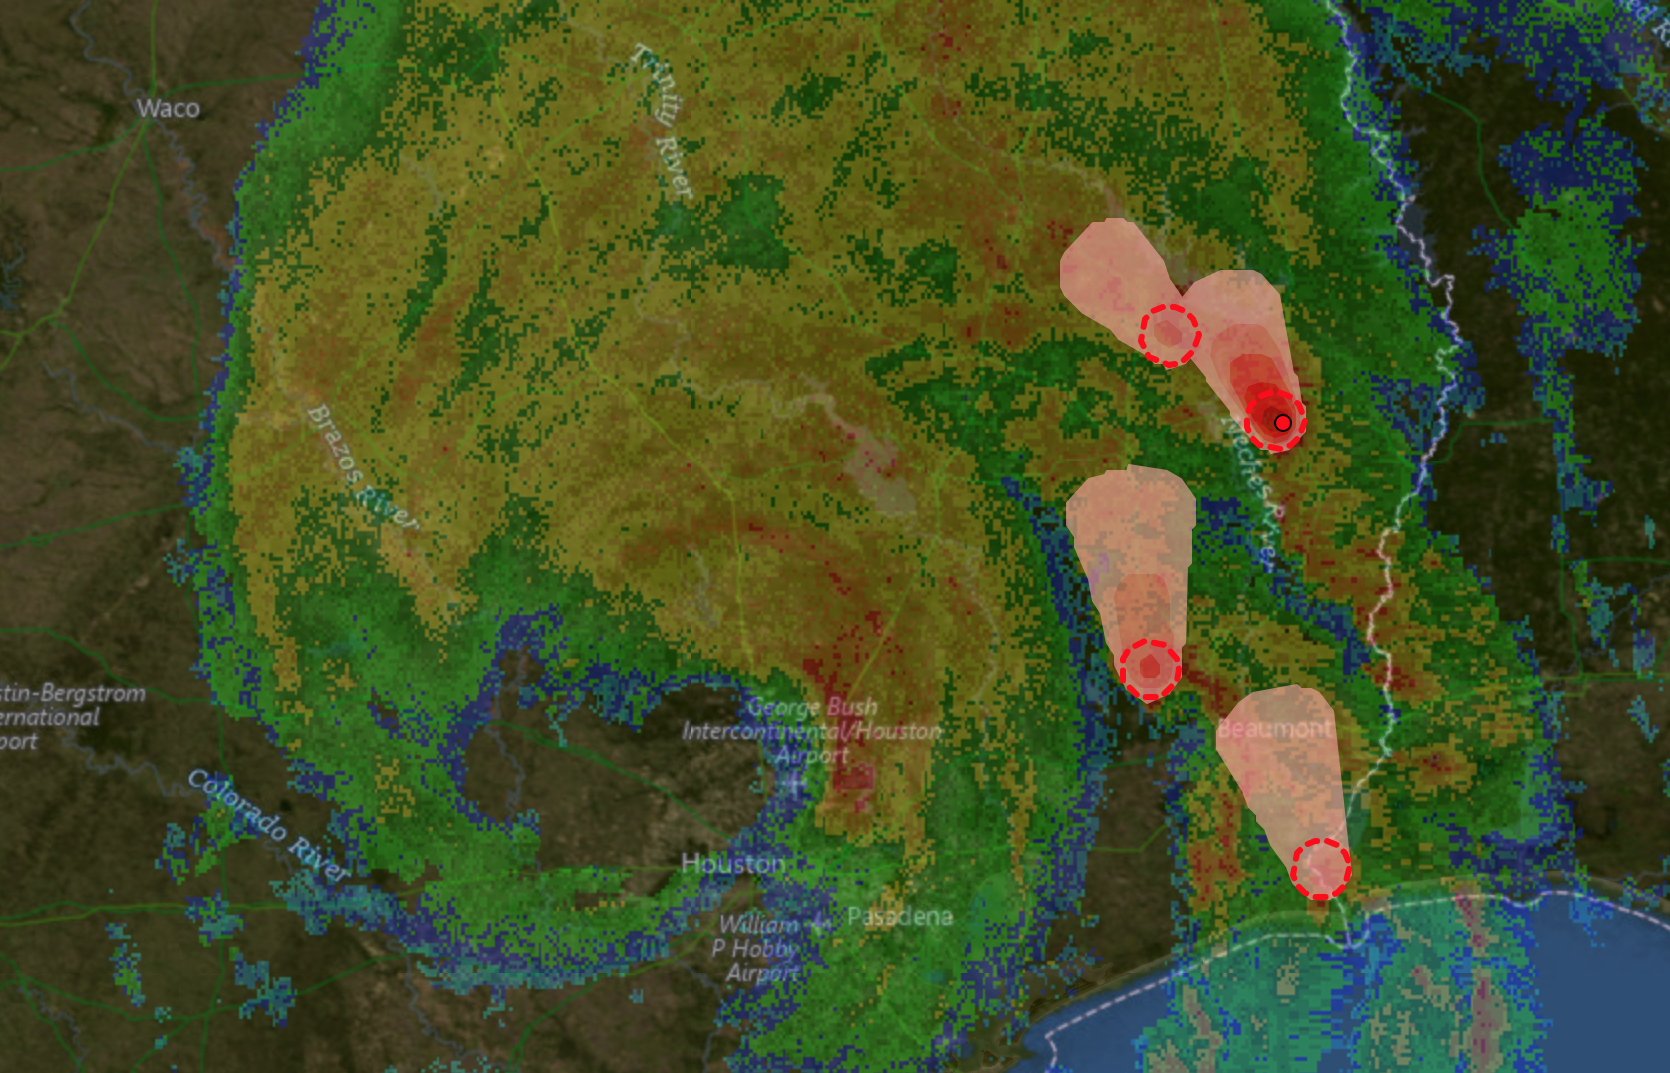
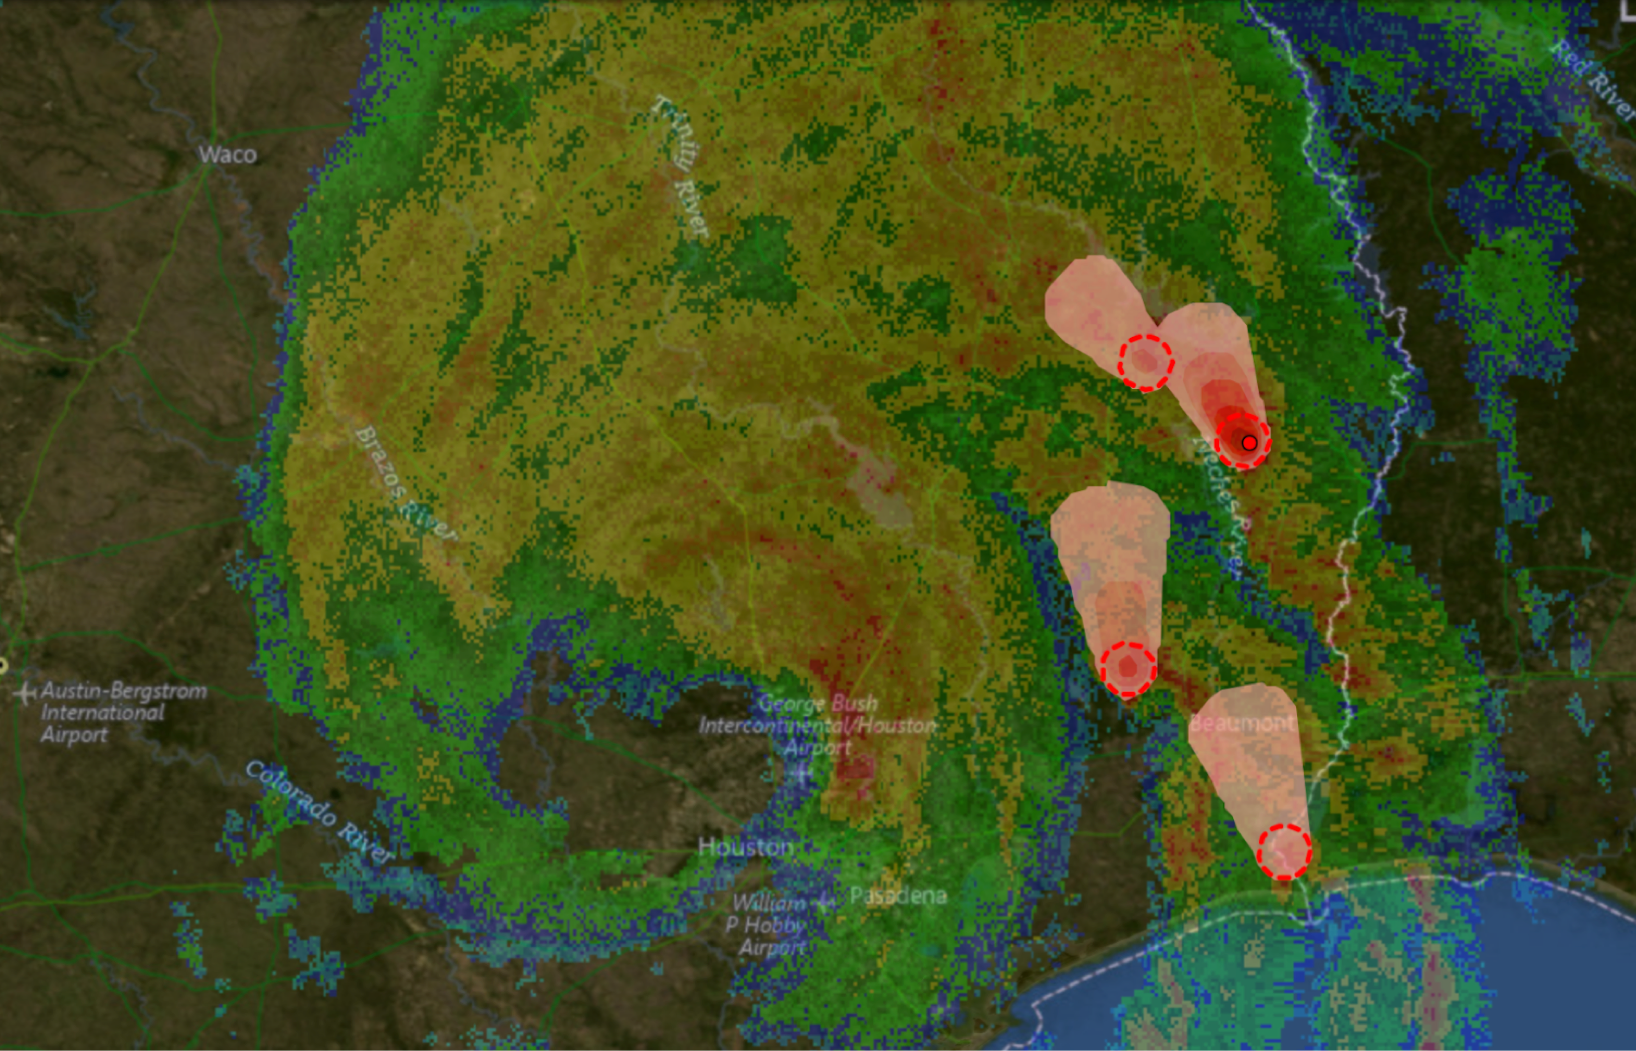
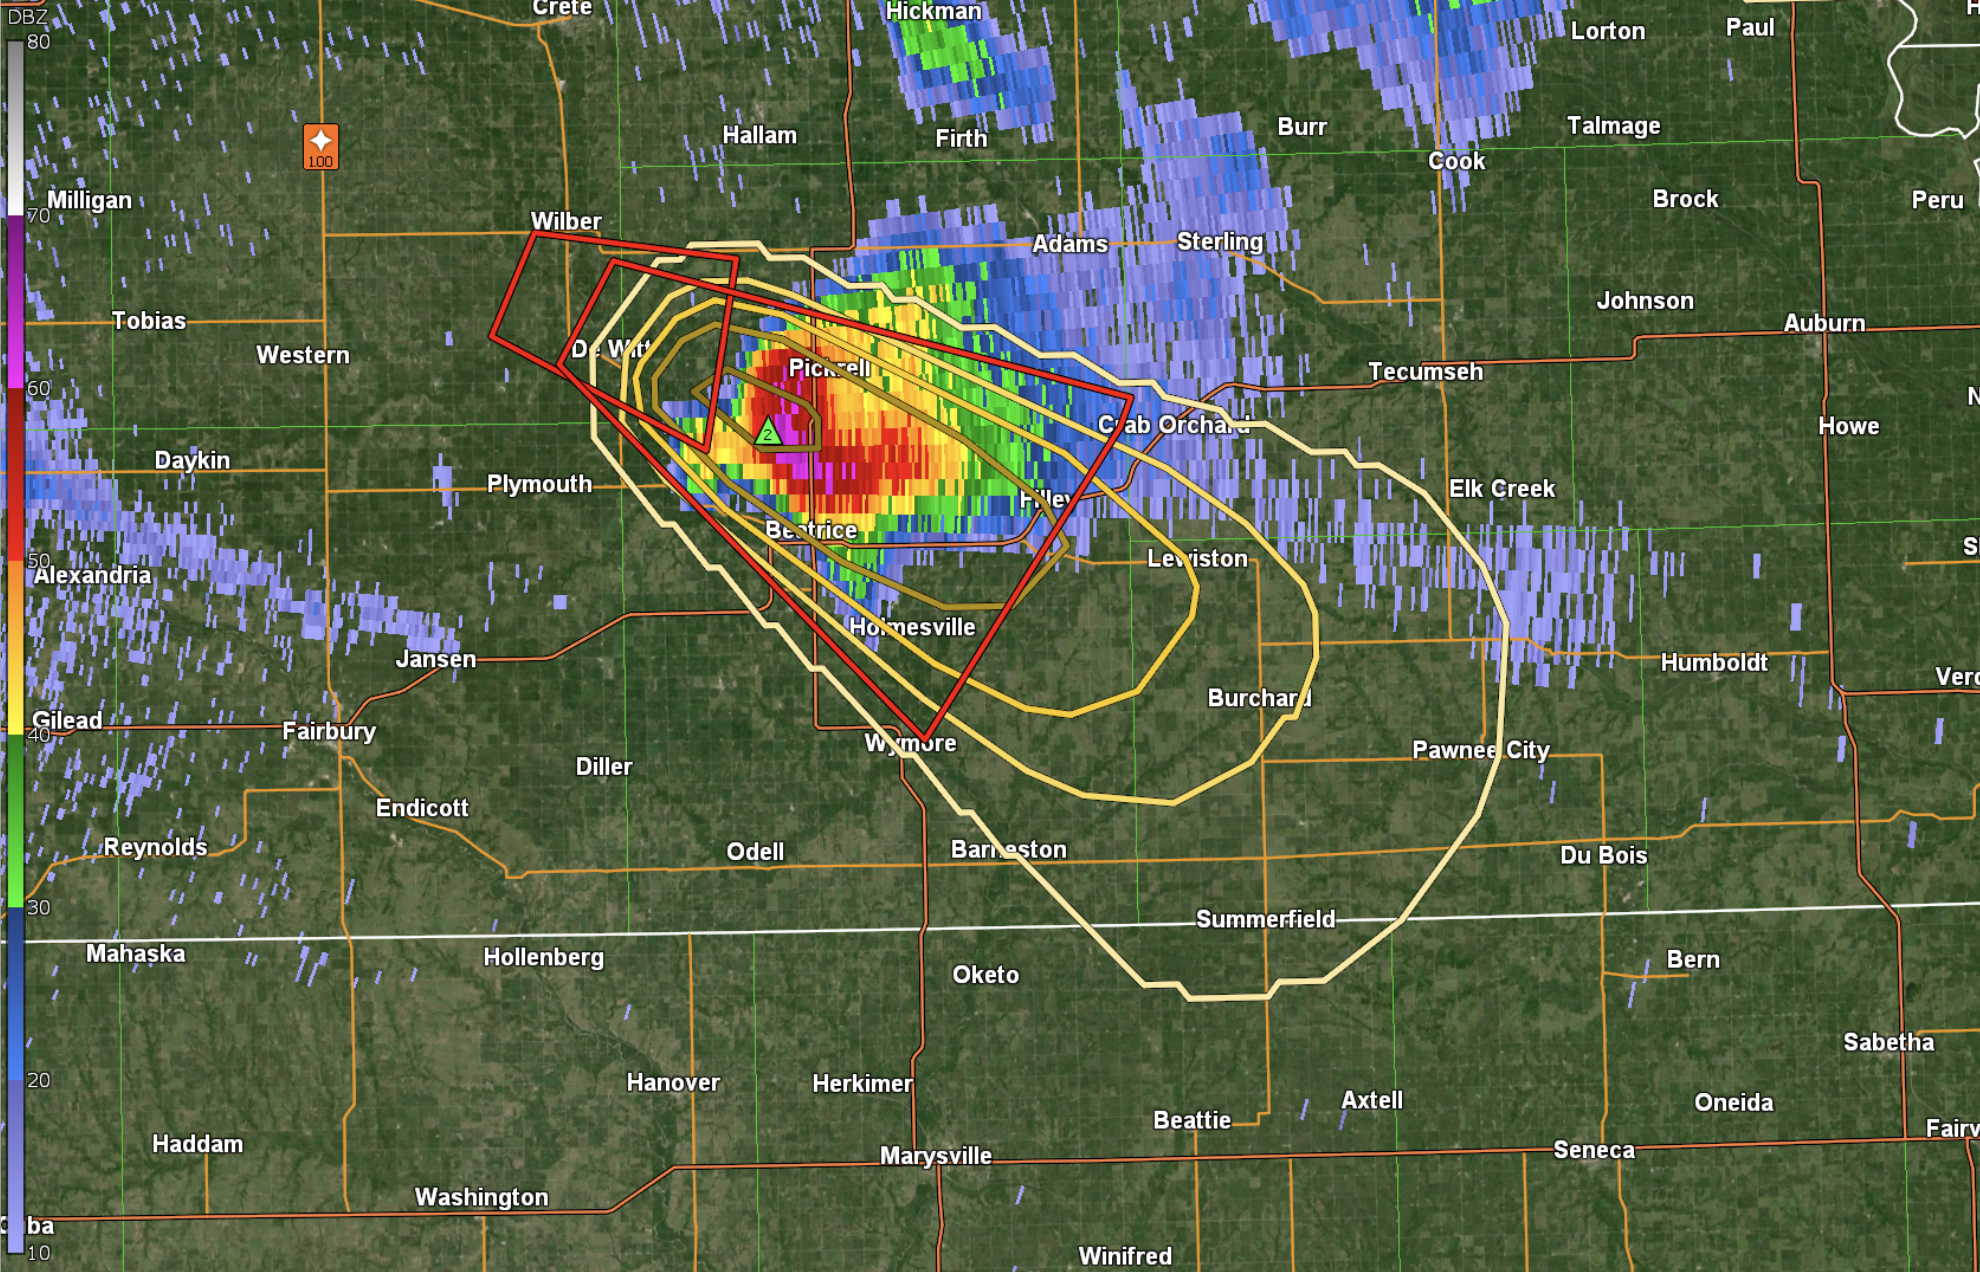
Probabilistic Hazard Information (PHI) is a storm-based product that conveys motion, timing, and likelihood of severe weather hazards (tornadoes, wind, hail, and lightning). PHI is derived from machine learning algorithms, such as TORP, ProbSevere, and ProbLightning and is updated every two minutes to rapidly detect and depict changes in storm evolution.

When PHI is paired with warnings from National Weather Service forecasters, PHI has the ability to provide additional lead time ahead of the warnings. PHI can also be used to provide guidance before the weather turns severe.

Shows a tornado local storm report falling within the higher probability contours of a tornado PHI plume during a hurricane. When animated, shows PHI plumes moving northward with their associated areas of tornadic rotation along with a bread-crumb trail of tornado local storm reports behind one of the plumes.
Hover or click on the image to watch how the data in this image evolves. Animation of tornado PHI (red shading, darker colors represent higher probabilities) derived from TORP (red dashed polygons) overlaid on base reflectivity from Iowa State University (rainbow shading) with tornado local storm reports from the Storm Prediction Center (solid red dots) during Hurricane Beryl.

A single severe PHI plume for a single storm shows how, when paired with NWS warnings, the PHI plume can provide notice of severe weather ahead of the warning. When animated, it shows how the PHI plume moves with the storm continuing to provide notice ahead and outside of the warning.
Hover or click on the image to watch how the data in the image evolves with time. Animation of severe thunderstorm PHI derived from ProbSevere (yellow polygons, darker colors represent higher probabilities) in GR2 overlaid on single radar base reflectivity (rainbow shading) and NWS severe thunderstorm warnings (red polygons).

How Can I View PHI?

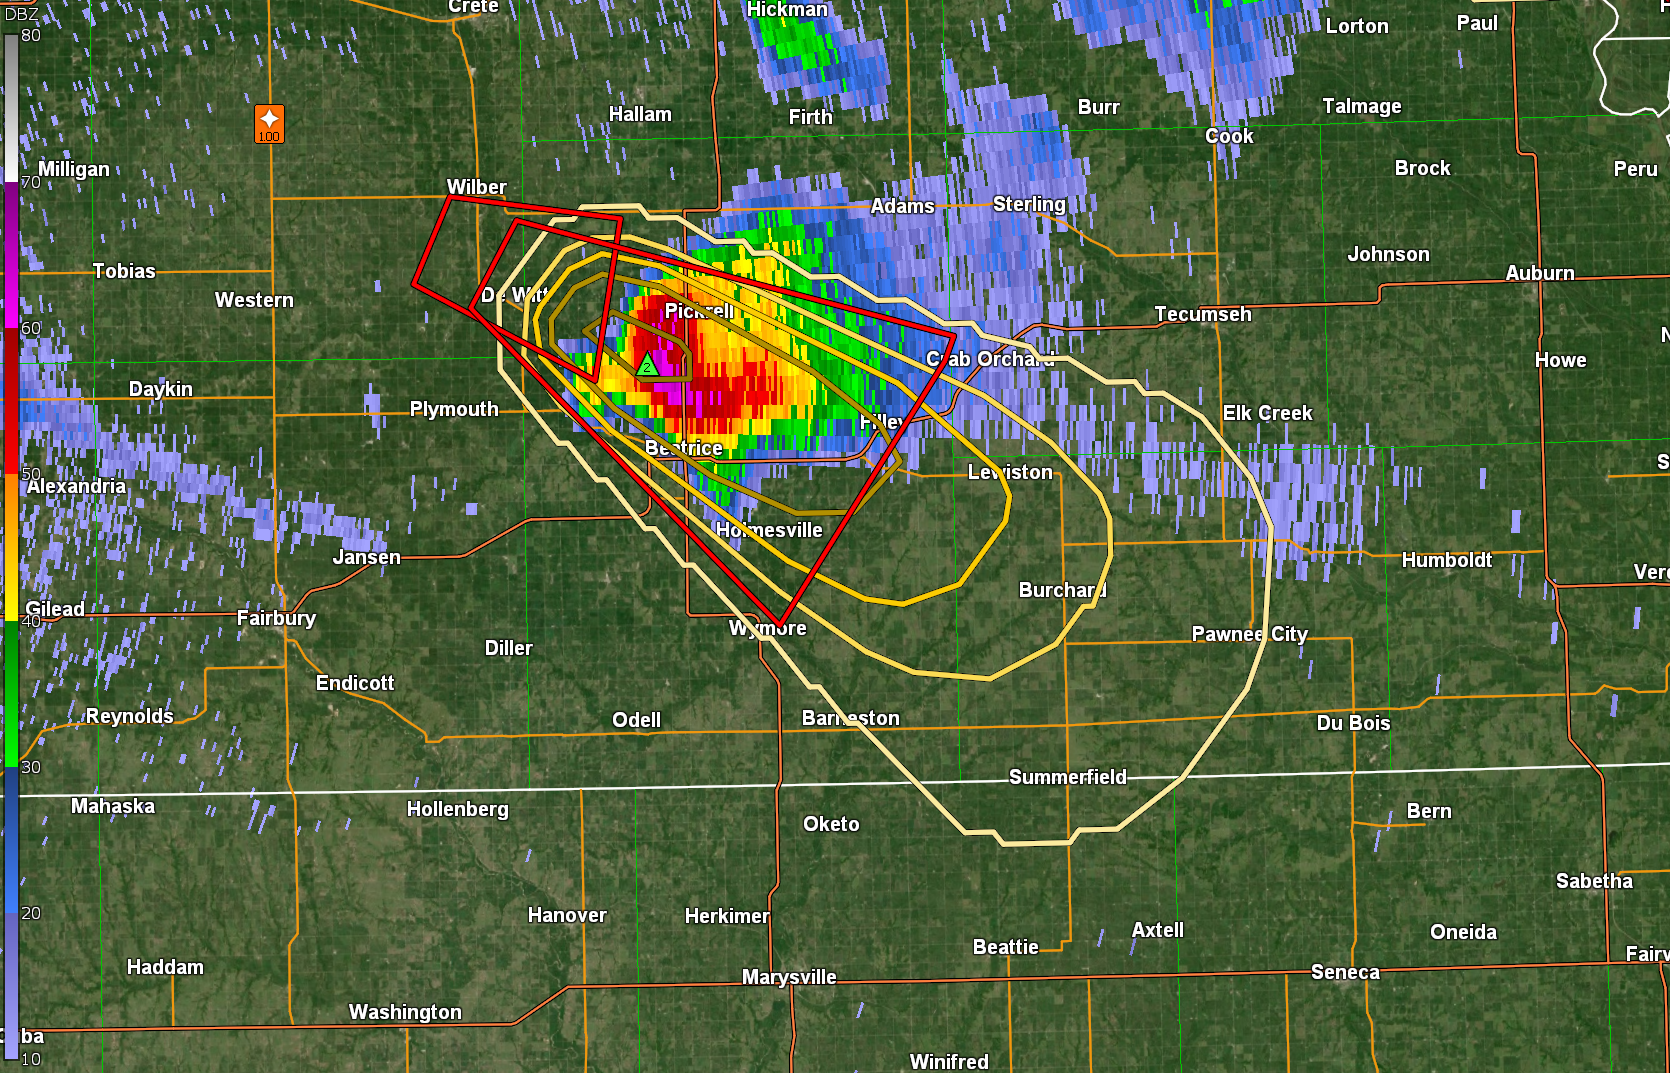
PHI is an experimental data product that is currently being evaluated by the National Weather Service (NWS) to enhance its accuracy, and currently has limited availability. To evaluate this data, NOAA forecasters and researchers can load placefiles of PHI into Gibson-Ridge 2 Analyst (GR2) and view the data in real time.

If you are involved in the evaluation and development of this data, click this link to be directed to the real-time flow of data and view the current domain coverage. If you are a NOAA researcher or NWS forecaster and would like to be involved with this evaluation, please fill out this form to request access to the data.


The Future of PHI

NSSL strives to "improve the lead time and accuracy of severe weather warnings" (NSSL). See how PHI and the proposed paradigm of FACETs support this mission by watching this video or visiting NSSL's website about FACETs.

The NWS has outlined its strategic plan for 2023-2033 and its supporting roadmaps, one of which is the Probabilistic Impact-based Decision Support Services (Prob-IDSS) Roadmap. PHI aligns with several of the goals and key objectives in the NWS Prob-IDSS Roadmap.